
The Velomobile Solution: Where Engineering Meets Urban Mobility
- Written by Velomobile World
A Data-Driven Revolution in Personal Transportation
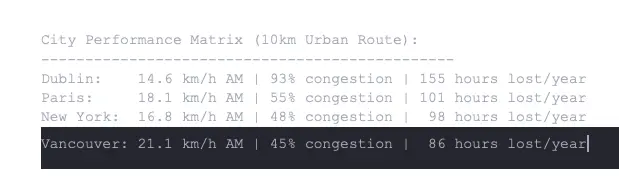
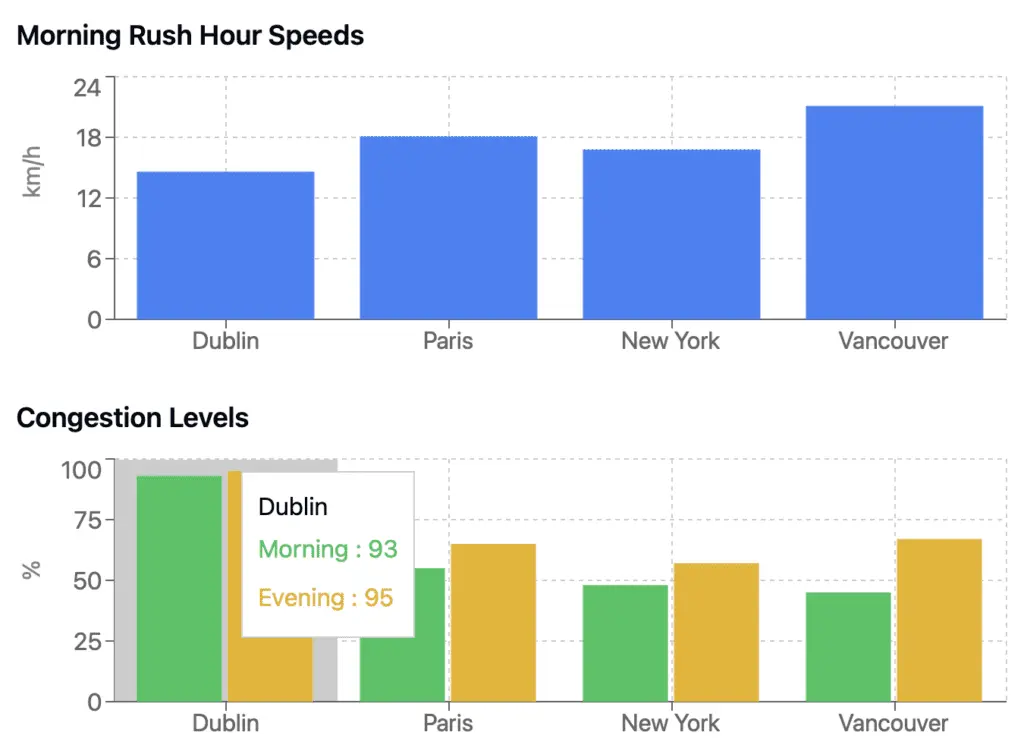
For those of us who appreciate both elegant engineering and practical solutions, today's urban mobility statistics present a compelling optimization opportunity. Our analysis of major global cities reveals a system operating far below optimal efficiency:
The Engineering Advantage
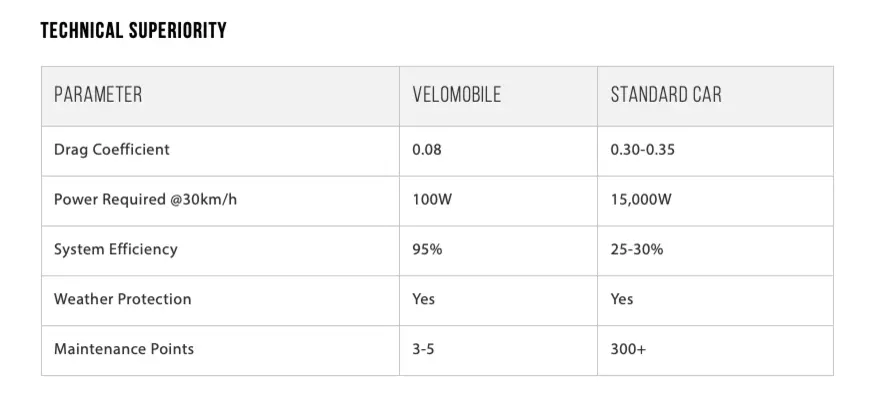
As an experienced professional, you understand that elegant solutions often emerge from fundamental physical principles. The velomobile represents such a solution:
Real-World Performance
- Predictable Journey Times
- Consistent 30-40 km/h cruising speed
- Traffic-independent performance
- Dedicated infrastructure utilization
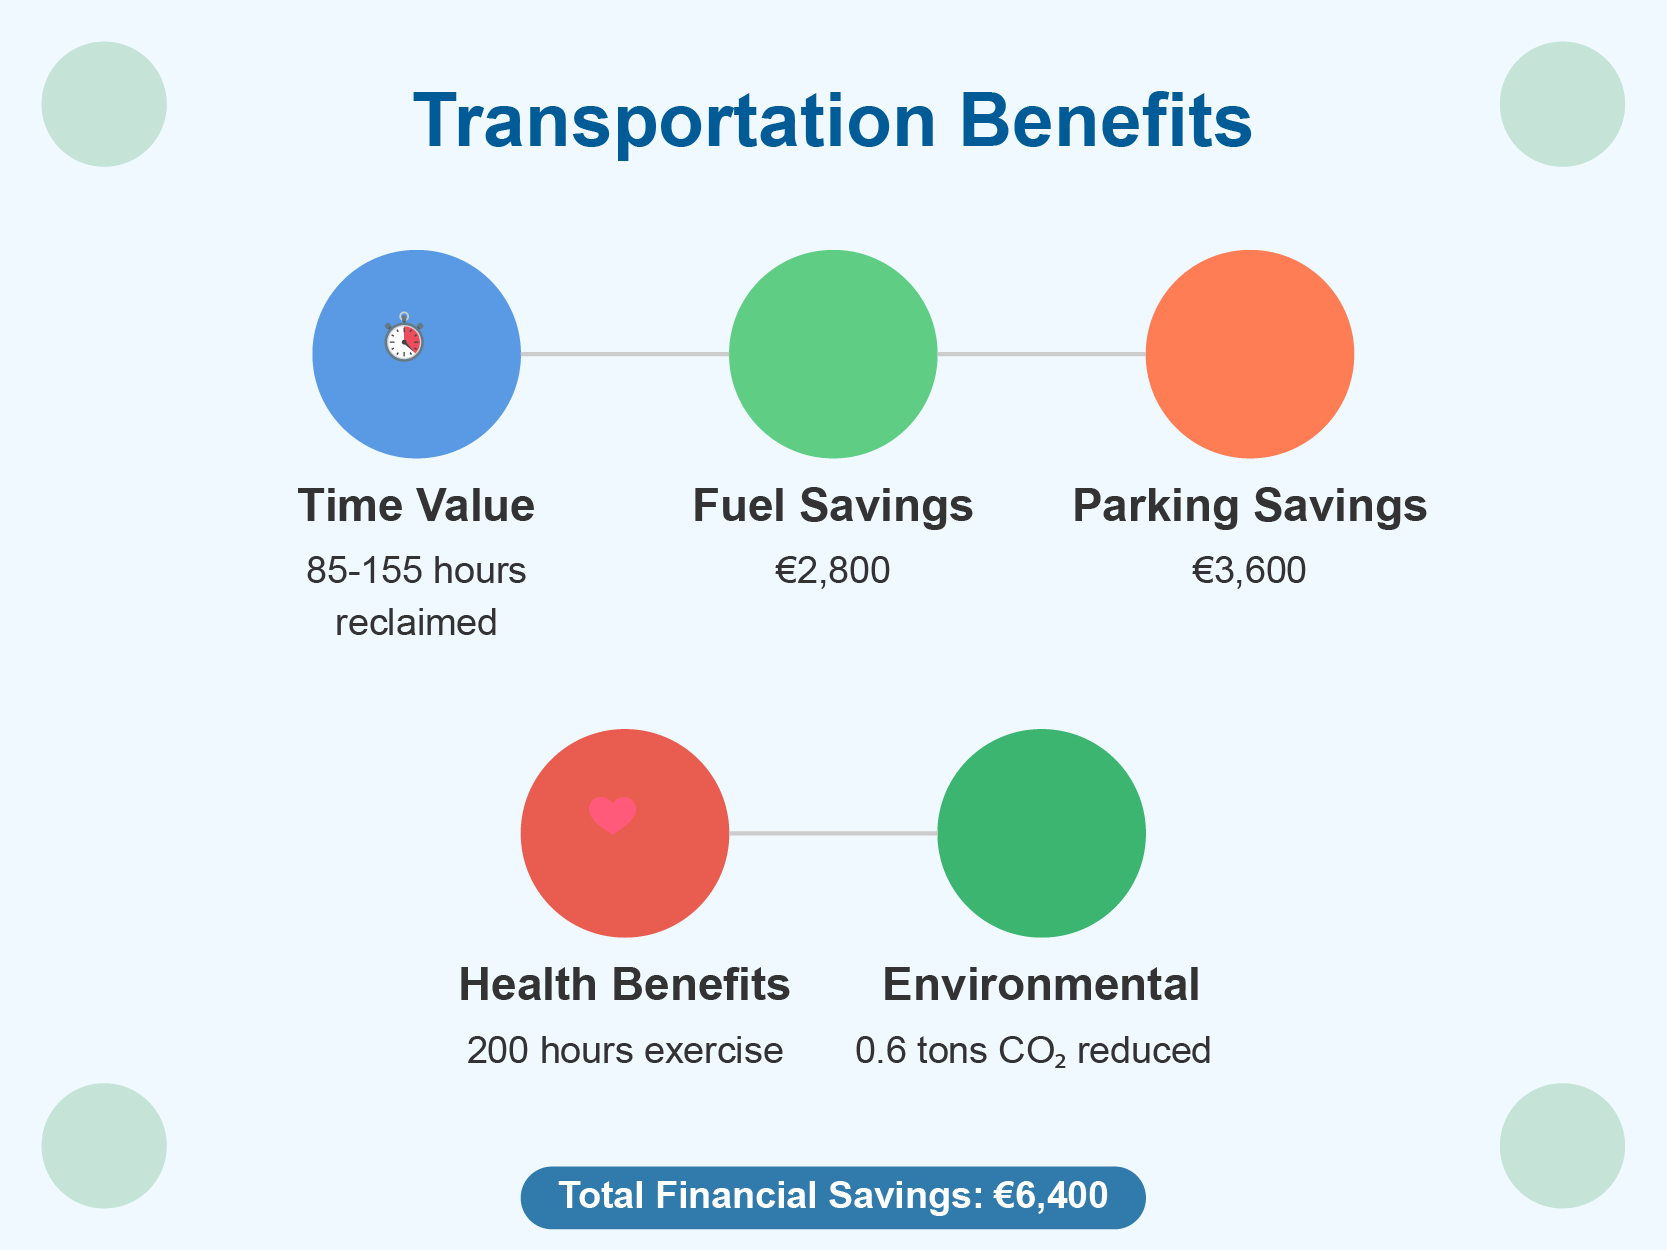
- Average time saving: 85-155 hours annually
- Resource Optimization
- Zero fuel consumption
- Minimal maintenance requirements
- Parking footprint: 2.3m² vs 12m² for cars
- Annual CO₂ reduction: 0.6 tons
The Executive Perspective
Beyond the technical specifications, the velomobile offers tangible business advantages:
- Predictable Scheduling: Arrive at meetings precisely when planned
- Professional Image: Lead by example in sustainable innovation
- Health Integration: Transform commute time into an exercise
- Cost Efficiency: Eliminate fuel, parking, and major maintenance costs
Making the Transition
For the analytical mind, the data speaks clearly: velomobiles represent a mathematically superior solution to urban mobility. Our team of engineers and mobility experts is ready to:
- Demonstrate performance metrics in real-world conditions
- Configure specifications to your requirements
- Provide detailed technical documentation
- Support your transition to optimized urban mobility
Experience the Future of Personalized Mobility
Schedule a test ride to verify these performance metrics yourself. Our team is available for detailed consultations and custom performance modeling.